Quick, important note:
Below, and elsewhere on my website, I link to my own publications (and publications by others). These links generally go to journal pages, and often the main content will be behind a paywall. PLEASE DO NOT PAY FOR MY PAPERS, (or those of any other scientist). Money paid to a journal to access an article does not go to the authors of that article, and authors generally have the right to share their articles upon request. I go into the details of publication finances here, but if you want to access my papers and they’re not here on the site, just email me, or reach out on twitter. I’d love to share them!
Now to your regularly schedule content:
We live in a world where we are more and more capable of gathering data. There are still so many things we don’t know (for example, there are still species being discovered every year, like the new whale species discovered in 2019, and the two adorable new Australian marsupial species discovered in 2020. There are also so many basic things we don’t know about existing species. For many herbivorous insects, we don’t actually know what they eat!). But at the same time, we have so much more data available to us than we ever have before.
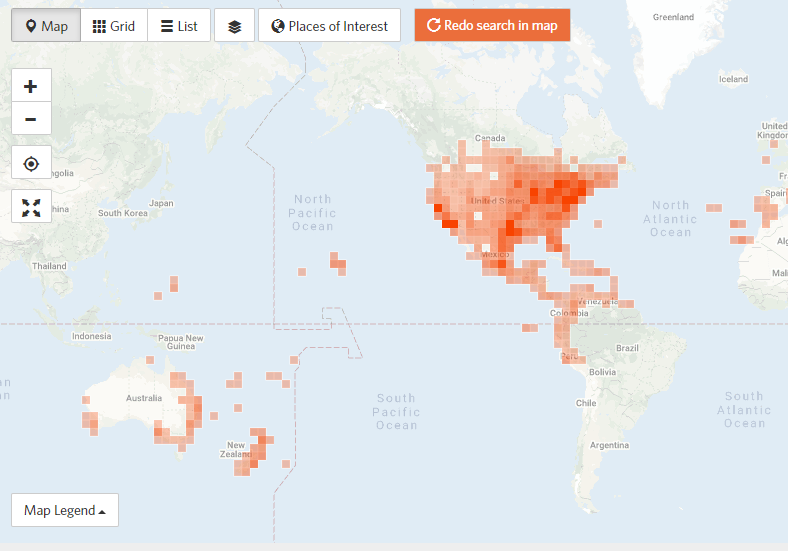
For example, let’s look at iNaturalist. This is an organization where anyone – you, me, the person down the street – can report sightings of plants and animals, including pictures and location. (I really like it because I can take pictures of something I don’t know, and other people will identify it!). If we take a look at their map of all monarch butterfly observations, we can see that there are more than 100,000 across world (116,200 as of the writing of this). When we have this much data available, one of our biggest challenges is to identify patterns in the data. That’s where statistics and math models come in. Those allow us to play Sherlock Holmes, trying to take the clues from all our data, and identify the underlying patterns – only instead of trying to find the murderer, we’re trying to understand how the world works.
One of my passions is to take the data we have, and develop or apply tools to find those underlying patterns.
Western monarch butterflies
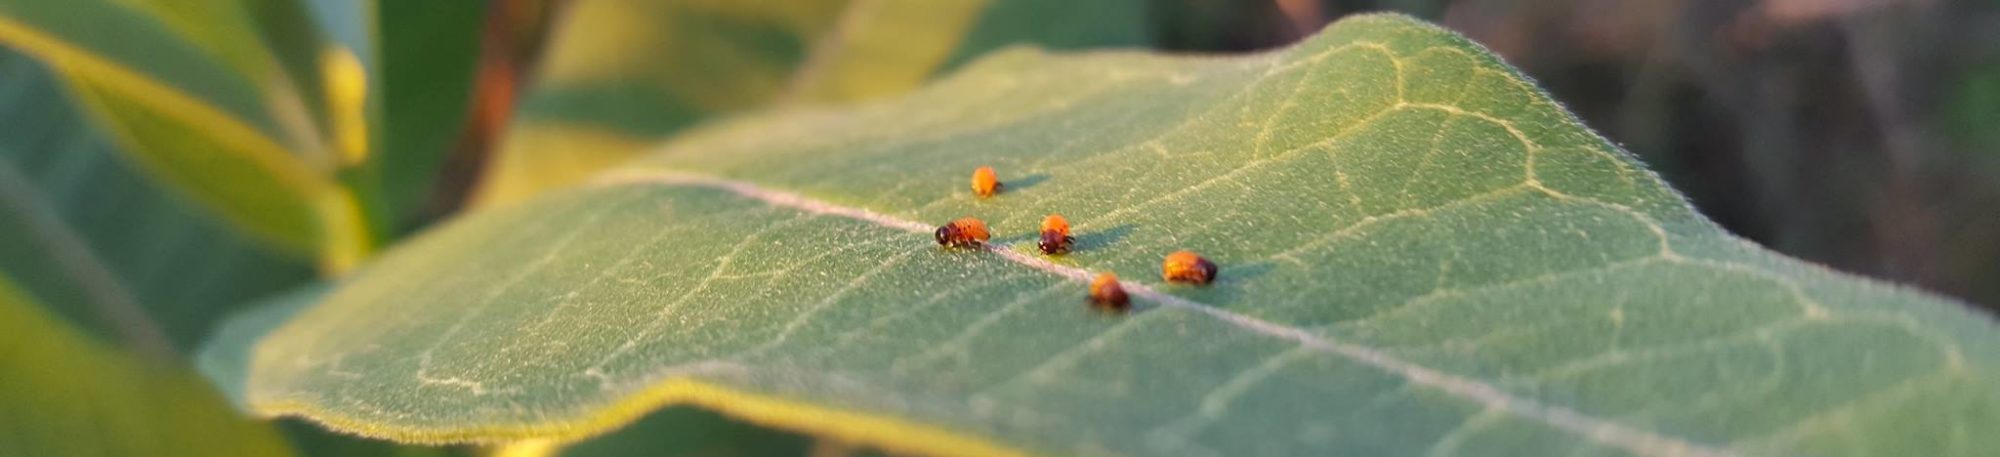
As an example, right now I’m working on the Western Monarch Butterfly. This butterfly is pretty amazing – in the winter, individuals keep warm by huddling in groups at a few dozen locations on the coast of California. In the spring, these individuals fly inland, and lay eggs in parts of California (and maybe Oregon? We’re not sure!). The caterpillars hatch, eat milkweed plants, grow big, turn into pupae, and eventually emerge as beautiful adult butterflies. This all happens in late spring, and these butterflies then fly further before laying their eggs. By the end of the summer, Western Monarch butterflies have spread throughout most of the western US – Washington, Oregon, Idaho, Nevada, even part of Canada! In the fall, the butterflies (who are the grandchildren and great-grandchildren of the ones that spent the winter in California) fly back to those same sites in California.
(In fact, they may be flying back to the same branches of the same trees their (great)grandparents spent the winter on. We’re not sure who it is, but each year monarch butterflies are on the same branches of the same tree.)
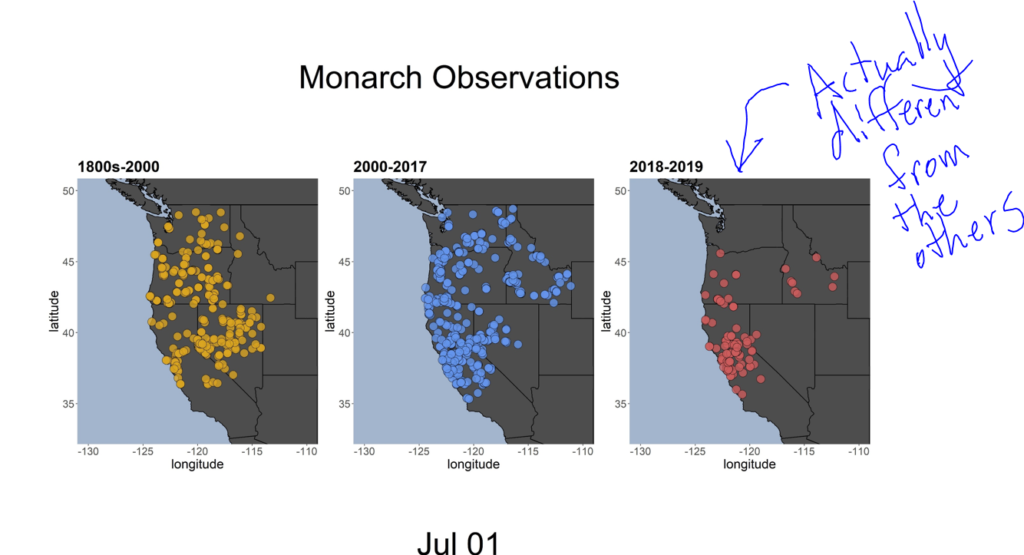
Unfortunately, the Western monarch butterfly populations have declined. A lot. We are now at less than 1% of the numbers we had in the 1990s. In particular, there was a big crash in the winter of 2017/2018, when about 85% of the individuals died. Before that crash, it was common for people to see the butterflies in Washington state in the summer. After the crash, it almost never happened. There are some theoretical reasons to think the yearly range expansion should be disrupted by the population decline, but even ignoring that, there seems to be a pretty clear pattern in the data. Here’s a map I made of all monarch sightings up through July 1 with data from the 1800s-2000 (orange), 2000-2017 (blue), and 2018 and 2019 (red):
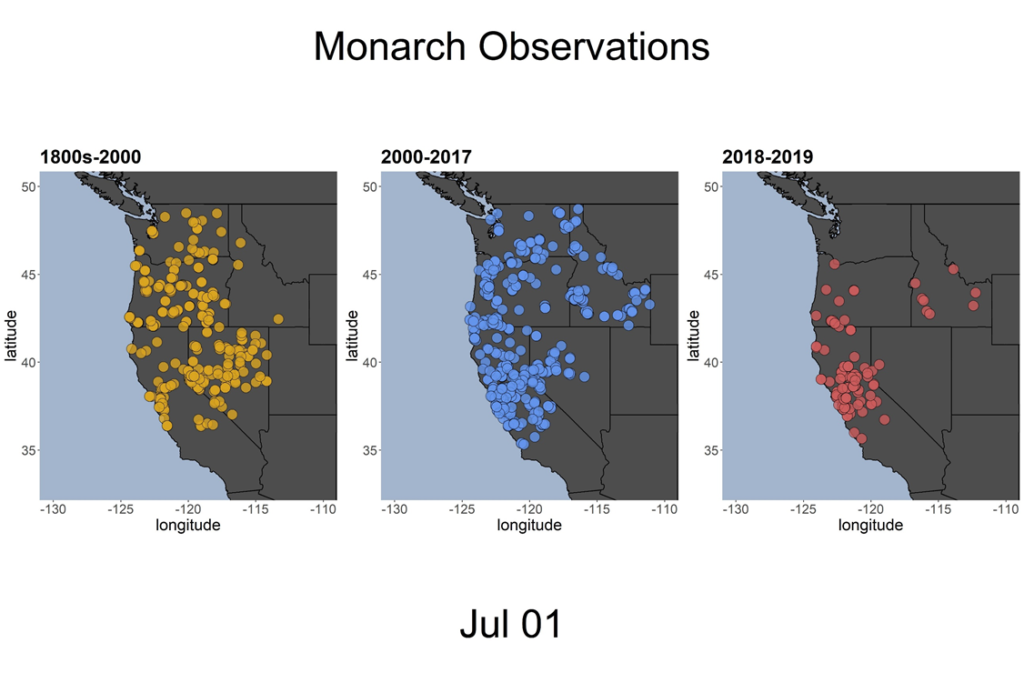
You can see that the red dots don’t seem to be going nearly as far – there aren’t any in Washington State, and hardly any in Idaho! Buuuuuut, there are also many fewer red dots (after all, we’re pooling together observations from two years, instead of from 17 (blue), or more than 100 (yellow)). So we really need a tool that will pick up real patterns that ISN’T dependent on the number of observations. After all, Sherlock Holmes doesn’t just jump to the simplest conclusion – he considers all the evidence, and figures out exactly what is mostly likely to really be going on.
The math is a bit complicated, but the short version is that Professor Elizabeth Crone and I worked out just such a method. We have a preprint online (basically a version of the paper before it’s been peer-reviewed and accepted at a journal), but I will warn you that it’s pretty technical. But for this example, the important parts are: (a) we can fit appropriate curves to our data, and (b) the method is very very robust to the number of data points we have (I did some simulations to try to break it, and only when we have almost no data at all does it break in the least). We start by taking those observations, and calculating the distance to the nearest overwintering sites. That gives us something that looks like this:
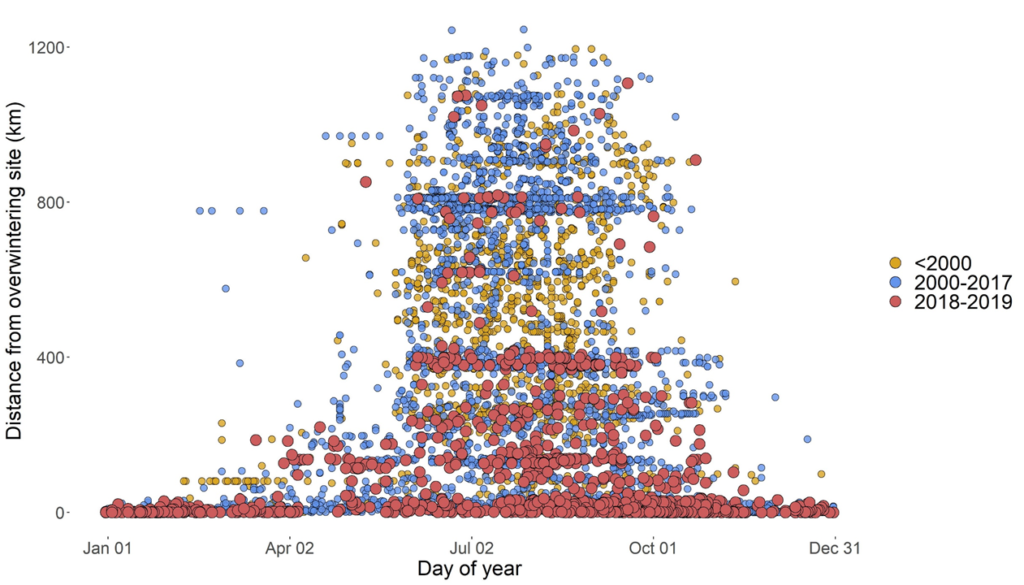
Okay, so here we have all the points on one plot, with day of year on the x axis, and distance from the overwintering site on the Y axis. So sightings in Washington or Idaho are going to be really high on the plot, and observations in the summer are going to be in the middle of the left-right direction. We can see that monarch sightings are mostly on or near the coast in the winter, and they expand outwards in the summer — it looks like they are at their furthest sometime in July, generally. It also looks like the red dots (which are the 2018 and 2019 data) aren’t going as far. Remember, one of our big questions is “Are they really not going as far?”
When we take those data points and fit them using the cool new method Elizabeth and I worked out, we get something that looks like this:
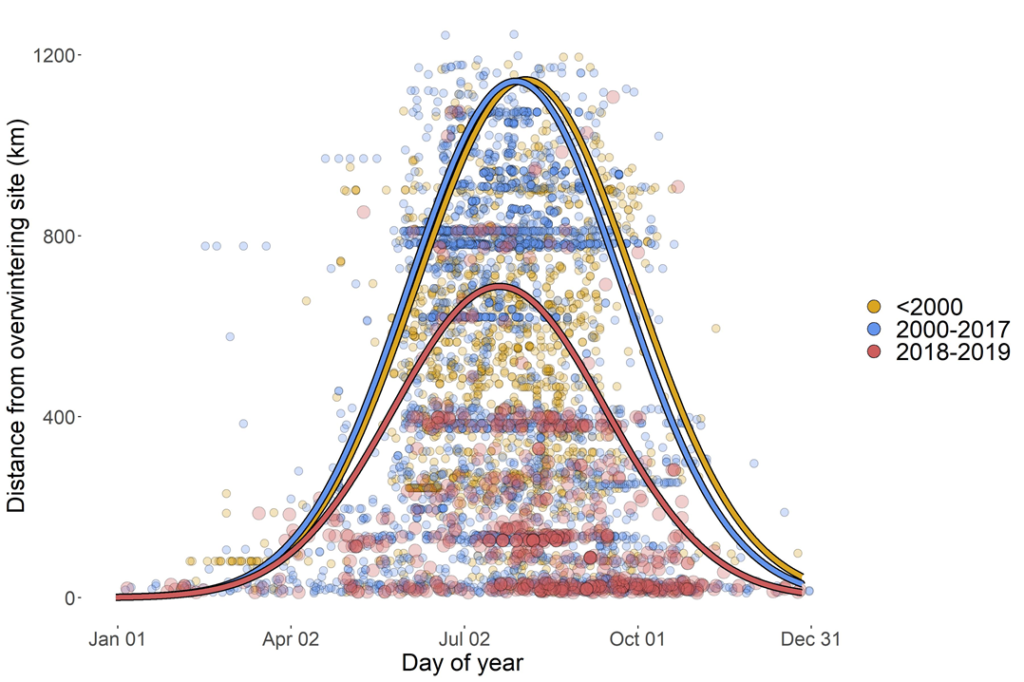
Now we have colored lines to represent what’s called the 0.9 quantile — it represents the distance between the 10% of the butterfly observations that were the furthest from the coast, and the other 90%. So we can think about it as a measure of how far the butterflies are reaching from the coast at that time. And wow, it sure looks like the red line is a LOT shorter – so the 0.9 quantile is not nearly as far from the coast. But with this method, we can actually estimate the uncertainty of our measures. Here’s our estimates and estimates of uncertainty for the height of each of those curves (that is, the maximum distance of those quantiles):
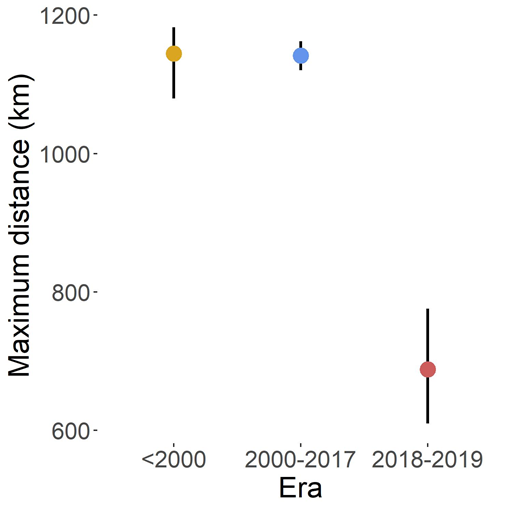
Okay, so that “maximum distance” figure is MANY steps abstracted from the maps we started with, but you can see that the red dot (estimated height of the red curve, so a measure of how far butterflies traveled in the past few years) is way lower than the other two dots, and the black bars (representing the possible other distances that seem reasonable, given our estimates for errors) are really separated. So even if our exact estimate is wrong, we’re really really confident that the butterflies are not going as far now as they were before. So now we know this:
And just because I can, here’s a sweet animation of observations and the fitted curve (color points appear on the map on the day they were observed, and are replaced 5 days later with a gray point):
Case closed!
Whether or not all the specifics make sense, this is how I like to structure a lot of my research – people have observations, and I try to find the underlying pattern, and what might be driving it.
This page is looking long enough at the moment, so I’ll provide links to my other research interests rather than turn this into a never-ending scrollfest.